Project Series
Crime Analysis in Toronto
-
Date: Apr 2023
-
Tool: Tableau
-
Data source:
-
Major Crime Indicators Open Data - Toronto Police Service
-
Unemployment rate - Statistics Canada
-
Ontario consumer price index - Government of Ontario
-
New housing price index - Government of Canada
-
-
Project Outcome: Interactive Dashboard
Project Summary
This personal project showcases two Tableau dashboards developed by Yi-Chen Hsiao, originally created as part of a broader group project exploring various aspects of life in Ontario. While the full group project has a larger scope, this portfolio piece focuses exclusively on one topic—crime analysis in Toronto—presented through a Tableau story.
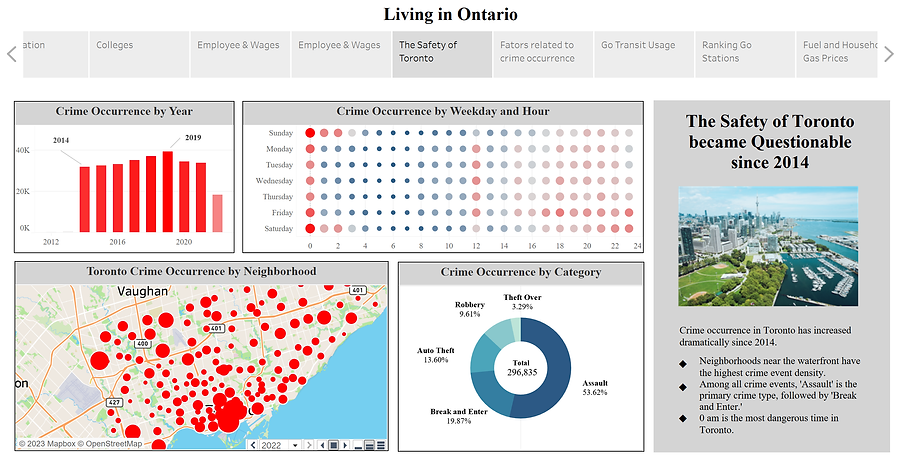
1. Interactive Crime Dashboard
This dashboard visualizes crime occurrences by year, hour/weekday, neighborhood, and category. Users can interact with the data by selecting specific years, neighborhoods, or crime types to examine more detailed breakdowns and uncover nuanced patterns.
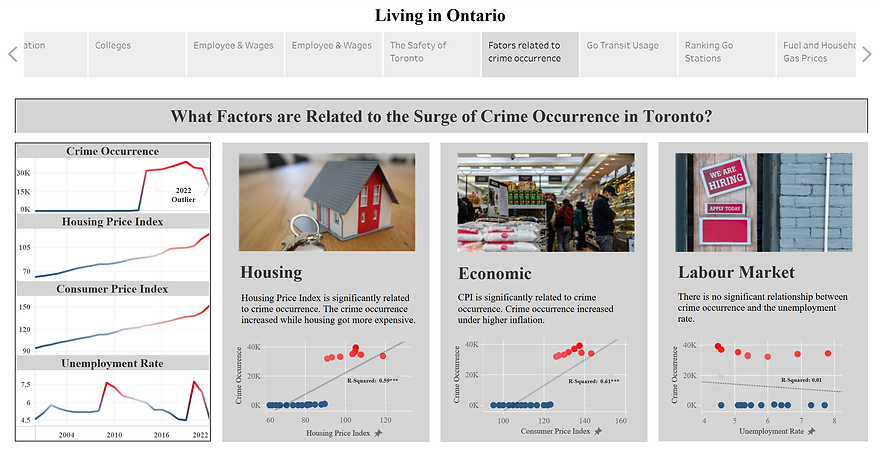
2. Crime and Socioeconomic Index Dashboard
This dashboard presents crime data alongside key socioeconomic indicators—Housing Price Index, Consumer Price Index, and Unemployment Rate. Through this integration, it highlights noticeable patterns and uncovers significant relationships, particularly between crime rates and both housing and consumer price indices.
Together, these dashboards offer viewers a dynamic and multifaceted perspective on Toronto’s crime landscape. Beyond understanding the severity of recent crime trends, users can also explore potential contributing factors through contextual data relationships.
Note: While this project is part of a course-based group project, all dashboards featured here were independently created by the site author (Yi-Chen Hsiao).
Visualizations
Demo - Interactive Dashboard
Dashboard 1: Interactive Crime Dashboard
Dashboard 2: Crime and Socioeconomic Index Dashboard