
Project Series
Clustering Analysis of
Employee Mental
Health Risks
-
Date: Sep 2025
-
Tools: Python, Visual Studio Code
-
Data Volume: 10,000 rows
-
Data Source: kaggle
-
Project Outcome: An evaluation of three clustering models to identify the optimal algorithm for mental health risk recognition.
Main Objective
This project aims to develop and evaluate three machine learning algorithms to cluster employee mental health risk profiles. The ultimate goal is to identify the model that best supports risk recognition and provides actionable insights for employers to take early preventive measures.
About Dataset
The dataset used in this study is sourced from Kaggle. It is a synthetic simulation that reflects real-world patterns observed in workplace mental health data. The dataset includes 10,000 individuals and 14 variables, encompassing demographic attributes such as age, gender, and employment type, as well as information about the work environment,
mental health scores, and related actions.

Data Cleaning:
Comprehensive checks were performed to ensure data integrity:
-
Missing Values: None detected across any variables
-
Outliers or Abnormal Values: No anomalies found
-
Duplicate Records: None identified in the dataset
As all checks returned clean, no further data cleaning steps were required.
Feature Engineering
-
Correlation between Variables:
-
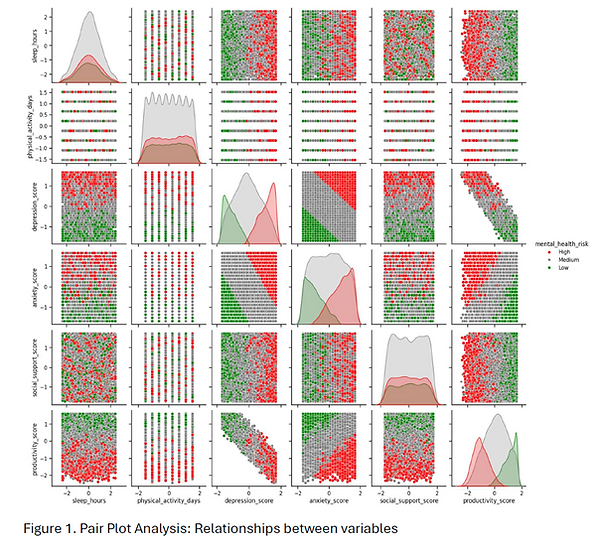
A strong negative correlation was observed between depression_score and productivity_score, with a correlation coefficient of -0.93, indicating that higher levels of depression are closely associated with reduced productivity.
-
No significant signs of collinearity were detected among the remaining variables, suggesting that each contributes uniquely to the clustering process.
-
Pair plot analysis shows no clear linear relationships among the remaining variables. However, it reveals that the distribution of each feature varies distinctly across the three levels of mental_health_risk: Low, Medium, and High (Figure 1).
-
Feature Selection:
-
Given the requirements of the clustering algorithms, only numerical variables were retained as features. Additionally, productivity_score was excluded due to its high collinearity with depression_score, which could distort clustering outcomes.
- A total of five features were selected for training the clustering models:
- sleep_hours
- physical_activity_days
- depression_score
- anxiety_score
- social_support_score
- Note: mental_health_risk is a categorical variable and was not included as a feature in the clustering analysis. However, it was converted to an ordinal data type for future evaluations—such as assessing cluster alignment with risk levels.
Feature Scaling:
-
Standardization (Z-score Normalization) was applied to scale features to avoid the algorithm overvalue the features with larger scales. The scaled features have values range from -1 to 1 (mean of 0 and standard deviation of 1).
Skewness check:
-
No significant skewness was detected in any of the numerical variables, indicating a relatively balanced distribution across the dataset.
Model Training Summary
1. K-Means
Number of clusters = 16
Training Summary:
-
Using the elbow method, the optimal number of clusters was identified around 15 to 16, where the curve of inertia reduction begins to plateau (Figure 2), indicating diminishing returns in model improvement beyond this point.
-
The silhouette score further validated this choice, suggesting 16 as the most appropriate value for k, based on cluster cohesion and separation.
-
As shown in Figure 3, the clusters are not solely differentiated by mental health risk levels. Instead, they exhibit subtle variations across multiple dimensions, which must be carefully interpreted before applying these clusters in practical settings. These nuanced differences could offer deeper insights into employee well-being beyond simple risk categorization.
2. Agglomerative clustering (Ward Linkage)
Number of clusters = 2
Training Summary:
-
The dendrogram analysis revealed a noticeable jump in linkage distance when the number of clusters was reduced to 23, suggesting a potential cutoff point (Figure 4).
-
To validate this, the silhouette score was computed across a range of cluster values from K = 2 to K = 23. The results indicated that K = 2 yields the highest silhouette score, confirming it as the optimal number of clusters.
-
Cluster Characteristics (Figure 5)
-
Cluster 1: Characterized by higher anxiety_score, higher social_support_score, and a slightly elevated mental health risk.
-
Cluster 2: Defined by higher depression_score and more physical_activity_days
-
3. Mean Shift
Number of clusters = 3
Training Summary:
-
The initial bandwidth suggested by the estimate_bandwidth function was 2.62, which resulted in a single cluster—likely due to the standardized feature range (−1 to 1).
-
To improve granularity, the bandwidth was manually tuned to 1.5, which produced 3 distinct clusters, offering more meaningful segmentation.
-
Cluster Characteristics (Figure 6)
-
Cluster 1: Characterized by higher anxiety_score, more physical_activity_days, lower social_support_score, and elevated mental health risk.
-
Cluster 2: Defined by higher anxiety_score, higher social_support_score, and a relatively lower mental health risk.
-
Cluster 3: Exhibits higher depression_score, more physical_activity_days, greater sleep_hours, higher social_support_score, and a moderate mental health risk.
-


Python Script Snapshots
The following script snippets offer a snapshot of the techniques used across different stages of the project. They are not exhaustive but aim to illustrate the diversity of operations involved.


Main Findings
Each clustering algorithm produced a different number of clusters, reflecting varying levels of granularity and practical applicability:
K-Means (16 clusters):
While this model offers detailed segmentation, the high number of clusters may be impractical for real-world implementation. It could be challenging to interpret and act on such fine distinctions across groups.
Agglomerative Clustering (Ward Linkage, 2 clusters):
This approach yields the simplest structure, which may support rapid deployment. However, the binary grouping may oversimplify the complexity of employee mental health profiles, potentially limiting the effectiveness of targeted interventions.
Mean Shift (3 clusters):
This model strikes a balance between simplicity and nuance. With three distinct clusters, it allows for faster implementation while still capturing meaningful differences in mental health risk and related features.
Conclusion
Based on clustering performance, interpretability, and practical relevance, the Mean Shift model (3 clusters) emerges as the most suitable choice for this dataset and topic. It offers a manageable number of groups while preserving enough detail to inform thoughtful, targeted action plans for employee mental health support.
To address the collinearity between depression_score and productivity_score, this analysis excluded productivity_score from the feature set. However, PCA offers an alternative by transforming correlated features into uncorrelated principal components, allowing both variables to contribute meaningfully without redundancy.