Project Series
Are We Safe to Return to Normal? – An ArcGIS StoryMap on COVID-19
-
Date: Mar 2023
-
Tool: ArcGIS Online
-
Data Source: Coronavirus COVID-19 Global Cases Dashboard from Johns Hopkins University
-
Project Outcome: An ArcGIS StroyMap
Project Overview
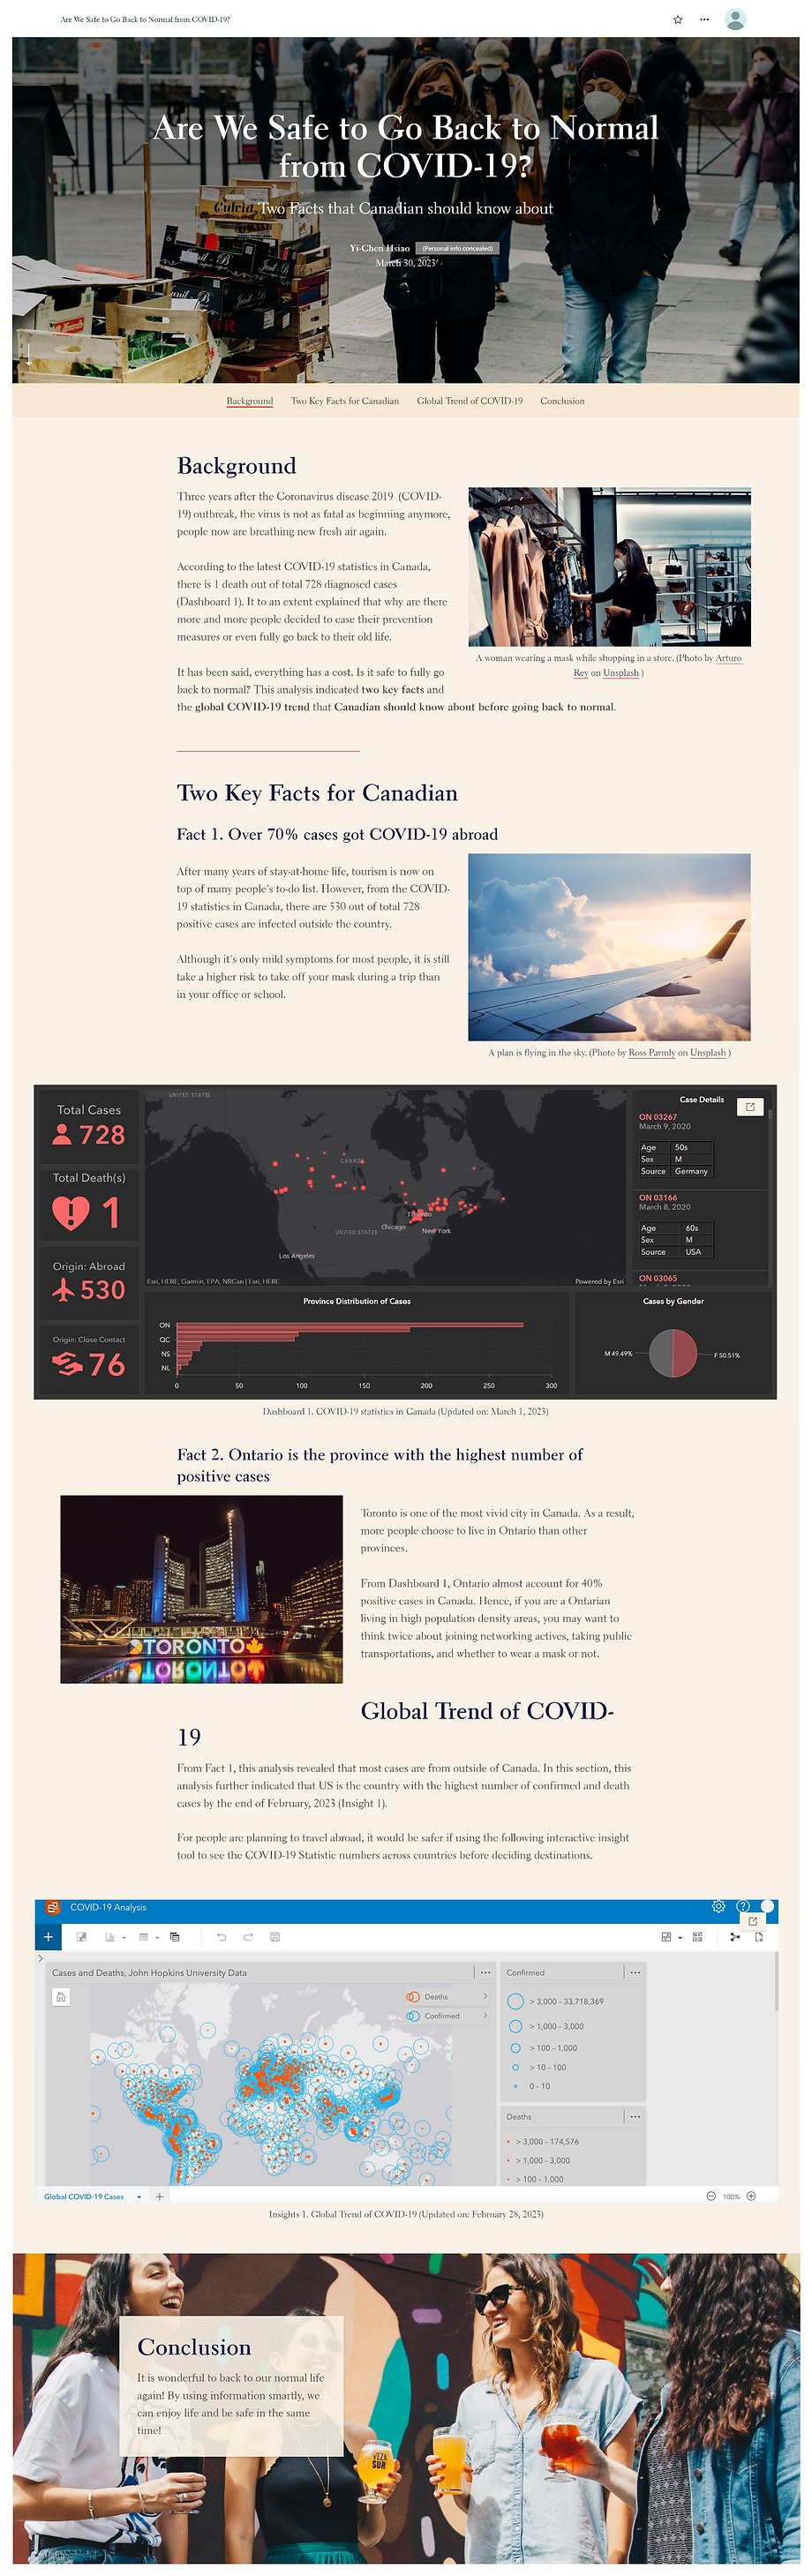
This interactive StoryMap was developed using ArcGIS Online to examine the spread and key indicators of COVID-19 across Canada, alongside global trends. By integrating spatial data, visual storytelling, and public health insights, the project aims to illuminate critical patterns and challenges faced during the post-pandemic recovery period.
Designed for a general audience, the StoryMap takes a conversational, blog-style approach. It integrates evidence-based information and visualizations to support everyday decision-making, such as choosing where to live or planning travel, while making complex data more accessible and relevant.
StoryMap Screenshot (ArcGIS Online)